Environment-wide association studies (EWAS) highlights the contribution of nongenetic components to complex phenotypes. However, the lack of high-throughput quality control (QC) pipelines for EWAS data lends itself to analysis plans where the data are cleaned after a first-pass analysis, which can lead to bias, or are cleaned manually, which is arduous and susceptible to user error. The Hall Lab offers a novel software, CLeaning to Analysis: Reproducibility-based Interface for Traits and Exposures (CLARITE), as a tool to efficiently clean environmental data, perform regression analysis, and visualize results on a single platform through user-guided automation. It exists as both an R package and a Python package. Though CLARITE focuses on EWAS, it is intended to also improve the QC process for phenotypes and clinical lab measures for a variety of downstream analyses, including phenome-wide association studies and gene-environment interaction studies. An example workflow is shown in figure 1.

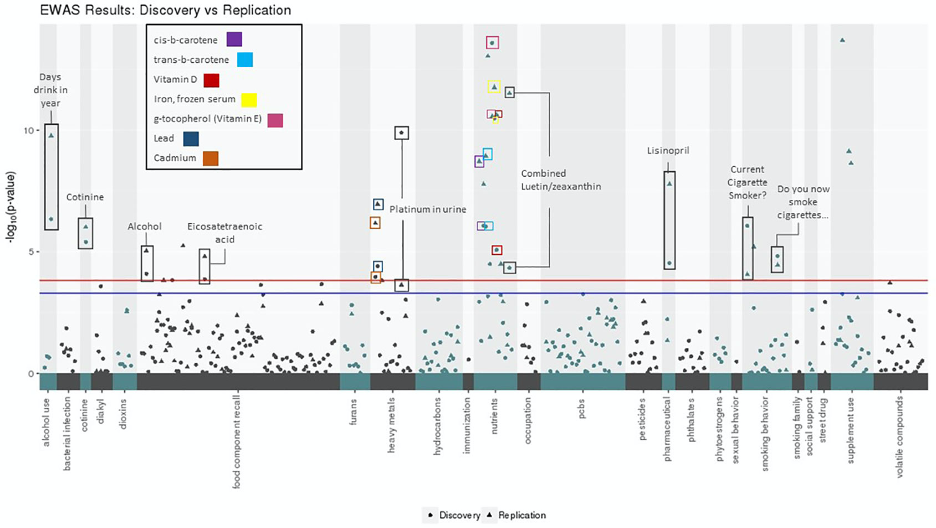
With the goal of demonstrating the utility of CLARITE, we performed a novel EWAS in the National Health and Nutrition Examination Survey (NHANES).. The results are shown in figure 2.

Questions?
If you have any questions not answered by the documentation, feel free to open an Issue or contact John McGuigan (John.McGuigan at psu.edu).
This work is/was supported by the USDA National Institute of Food and Agriculture and Hatch Appropriations under Project #PEN04275 and Accession #1018544